XRP, the digital asset associated with Ripple, was trading around $1.43 on Monday, April 20, 2026, after a rally that briefly pushed it above $1.50 last week lost momentum. The token has given back approximately 6% from its Friday peak as the broader cryptocurrency market experienced a pullback over the weekend.
ETF Inflows Provide Institutional Backing
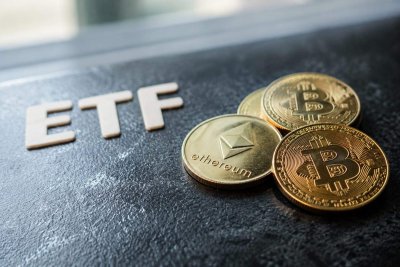
A significant driver of recent attention is sustained institutional interest. Data from SoSoValue indicates that U.S.-listed spot exchange-traded funds (ETFs) linked to XRP attracted a net $55.39 million in inflows during the week of April 13-17. This marks the most substantial weekly inflow for these investment products so far in 2026. Ripple has previously reported that U.S. spot XRP ETFs surpassed $1.5 billion in cumulative inflows by early March, with five products actively trading and holding over 769 million XRP tokens in custody.
Bitwise Chief Investment Officer Matt Hougan noted that these ETFs are drawing "institutional and professional investors" and are being utilized "as part of a broader crypto allocation." This growing institutional footprint provides a fundamental pillar for the asset's valuation, which currently stands near $88 billion.
Technical Levels Define the Battlefield
The immediate price action is framed by clear technical levels that traders are watching closely. Analysts identify $1.41 as a crucial short-term support level. The $1.46 to $1.50 range now acts as a formidable resistance zone that XRP must convincingly break through to signal a renewed bullish trend.
Technical commentary suggests that a sustained move back above $1.46 could open a path toward the $1.55 to $1.57 area. Conversely, a breakdown below the noted support, particularly a loss of the 50-day moving average around $1.38, could see the token retest the $1.28-$1.30 range. The 30-day volume-weighted average price (VWAP) sits near $1.37, adding another metric for traders to gauge the asset's health.
Outperformance and Market Context
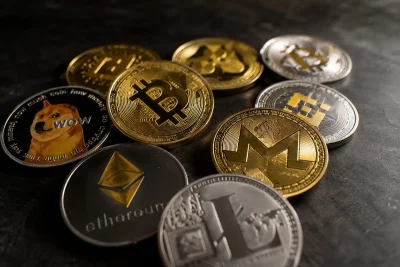
Despite the recent dip, XRP demonstrated relative strength last week. It gained roughly 8% over the five-day period ending April 18, outperforming major peers bitcoin and ether. However, some analysts characterized the move as being driven by thin participation rather than a broad-based surge, indicating caution remains among the wider investor base.
The asset's performance has, at least temporarily, decoupled from the broader large-cap crypto trade. Its ability to maintain this separation will depend on its unique catalysts, such as ETF flows and developments in its utility ecosystem, against the backdrop of overall market sentiment.
Utility Expansion and Macro Risks
Beyond speculation, developments aim to increase XRP's functional use. Hex Trust announced plans for wrapped XRP (wXRP), a tokenized version pegged 1:1 to XRP, designed to operate on blockchains like Solana, Ethereum, Optimism, and HyperEVM. This initiative, aimed at "expanding XRP liquidity in DeFi," would grant users access to decentralized finance applications for swaps and liquidity provision.
Macroeconomic risks persist, however, and could overshadow token-specific news. Reports of renewed tensions in the Strait of Hormuz contribute to uncertainty in oil and broader risk markets. In such an environment, if bitcoin were to decline significantly, it could trigger a sector-wide reduction in exposure, pressuring XRP regardless of its individual merits.
The Path Forward
The current setup presents a mixed picture. On one hand, XRP benefits from clear institutional demand via ETFs, demonstrated relative strength, and a more mature investment narrative than in prior periods. On the other, it faces immediate technical headwinds at the $1.46-$1.50 level, where recent selling pressure emerged.
Analyst models and AI tools present a range of scenarios, from a short-term consolidation between $1.25 and $1.45 if resistance holds, to more bullish year-end forecasts contingent on regulatory developments like the U.S. CLARITY Act and continued ETF adoption. For now, the asset's trajectory hinges on converting the $1.46 resistance into a support base, a move required to validate the recent rally and build a foundation for further gains.