Australia's benchmark equity index suffered a second consecutive day of losses on Friday, sliding 1.21% as surging oil prices and renewed inflation worries triggered a sell-off in heavyweight mining stocks. The S&P/ASX 200 closed the session at 8,712.9, down 106.5 points from Thursday's 8,819.4, after touching an intraday low of 8,699.8. This puts the index 3.25% below last Friday's close of 9,005.9 and on track for its worst weekly performance since early March.
Miners lead the decline
The immediate catalyst was a continued spike in crude oil prices, with Brent crude hovering near US$107.93 after peaking at US$110.19 intraday. The jump in energy costs exacerbated fears that inflation could remain stubbornly high, delaying potential interest rate cuts and pressuring rate-sensitive sectors. The selling was concentrated in the resource giants: BHP Group (BHP) tumbled 4.65% to A$60.49, while Rio Tinto (RIO) fell 4.25% to A$167.06. Fortescue (FMG) dropped 2.44%, Xero (XRO) lost 3.21%, and CSL (CSL) declined 1.81%.
Not a uniform sell-off
Despite the broad market decline, the weakness was not indiscriminate. Commonwealth Bank (CBA) rose 0.32%, and Woodside Energy (WDS) held nearly flat despite the oil shock. This divergence underscores that the index's slide was disproportionately driven by large resource names rather than a collapse across all heavyweight stocks. Thursday's session had already set a negative tone, with the ASX 200 losing 1.03% as Brent crossed US$100 and all 11 sectors closed lower.
Key technical levels
For index investors, the 8,700 level is the first critical support to watch, as Friday's low sits just beneath it. A sustained break below this level would confirm that the sell-off is broadening. Conversely, a recovery above Thursday's close of 8,819.4 would be more meaningful than an intraday bounce, as it would erase the second leg of the decline.
ASX Ltd shows resilience
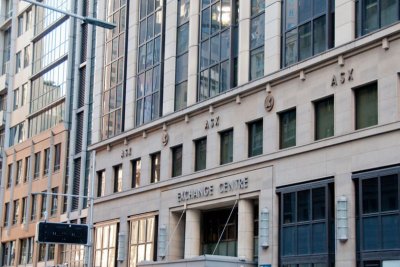
In contrast, ASX Limited (ASX), the company that operates the Australian Securities Exchange, fell only 0.90% to A$54.82. This relative resilience is logical: volatile markets typically generate higher trading volumes, clearing activity, and demand for real-time data, which directly benefits the exchange operator. ASX's August activity report showed average daily cash-market trades up 22% year-over-year, on-market value traded up 11% to A$7.927 billion per day, and average daily futures volume up 26%. These figures predate this week's volatility spike, so September's report will provide a clearer picture of whether the sell-off translated into a meaningful revenue tailwind.
Long-term challenges for ASX
However, a single volatile week does not constitute an earnings upgrade. A prolonged risk-off environment can dampen new listings and secondary raisings, even as trading fees improve. August illustrated this tension: new capital quoted fell 13% from a year earlier, and net new capital was negative A$6.0 billion. Costs remain another constraint, with ASX expecting FY27 total expenses to grow 18% to 21% and capital expenditure of A$180 million to A$200 million, largely due to technology modernization. FY26 underlying profit rose only 5.2% despite a 13.3% revenue increase, while statutory profit fell 3.5%. At A$54.82, the FY26 dividend of A$2.065 per share implies a trailing yield of about 3.77% before franking credits, but that dividend was 7.5% lower than the prior year.
What to watch
The clearest bull signal would be September cash and futures volumes holding well above August levels without further deterioration in listings. Conversely, a bear signal would emerge if a temporary burst of trading revenue is followed by weaker capital formation while expense growth remains near 20%. For now, the market is drawing a sensible distinction: the ASX 200 is absorbing an oil-and-rates shock through its miners and other duration-sensitive stocks, while ASX Limited acts as a toll collector on the resulting activity—but one with a substantial technology bill and a listings franchise that still needs healthy markets.