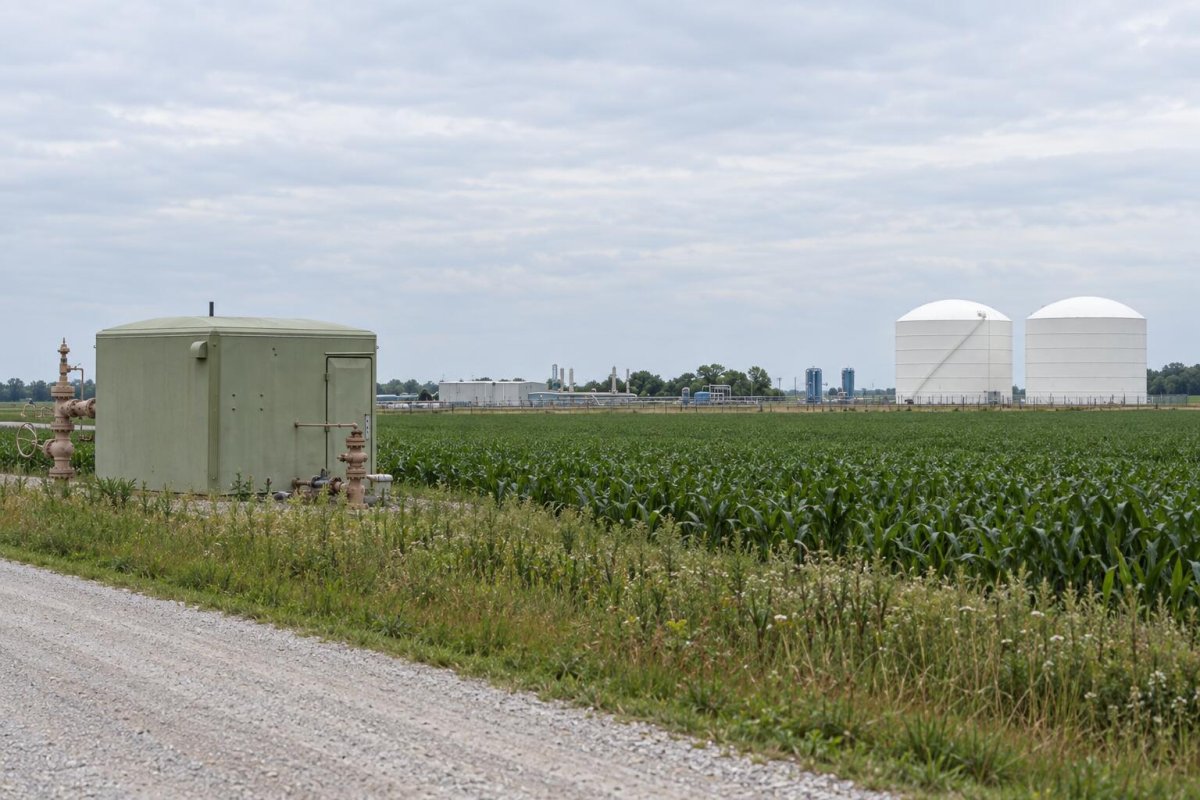
The natural gas market enters the weekend with a substantial supply cushion that continues to weigh on prices. Inventories stand 148 billion cubic feet (Bcf) above the seasonal norm, while front-month futures remain stubbornly below the $3 mark. This combination places the burden of proof squarely on bullish traders as the winter season approaches.
On Friday, October Henry Hub futures settled at $2.820 per million British thermal units (MMBtu), a decline of 0.5% from the previous session, according to delayed NYMEX data from Yahoo Finance. The soft close followed a weekly storage report that revealed a looser-than-expected supply picture at the national level.
Storage Injection Exceeds Expectations
The Energy Information Administration (EIA) reported a 40 Bcf injection into working gas storage for the week ended September 4, surpassing the roughly 35 Bcf consensus tracked by Sprague Energy. Total Lower 48 inventories now stand at 3,254 Bcf, which is 79 Bcf below the same week last year but 148 Bcf above the 2021–2025 five-year average.
This surplus, representing about 4.8% above normal, reflects a supply system that is refilling faster than historical patterns. Production continues to expand, adding further downward pressure on prices. The immediate takeaway for investors is clear: sub-$3 gas is not merely a reaction to one mild week but a structural feature of the current market.
Regional Divergence: East Builds, South Central Draws
However, the regional breakdown reveals a more nuanced story than the headline numbers suggest. The bulk of the injection occurred in the East (up 20 Bcf) and the Midwest (up 18 Bcf), while South Central inventories actually declined by 7 Bcf. Notably, fast-cycling salt caverns in that region saw an 11 Bcf drawdown, leaving them 3.8% below their five-year average.
This distinction is critical because salt caverns offer greater operational flexibility. According to EIA analysis, these facilities account for only about 10% of total storage capacity but provide roughly 28% of daily deliverability. Traders should not treat every stored cubic foot as equally responsive to sudden demand spikes; the salt cavern draw is an early signal of potential tightness in specific scenarios.
What Could Push Prices Above $3?
The base case still favors a comfortable start to winter. In its September Short-Term Energy Outlook, the EIA projects working gas inventories at 3,969 Bcf by October 31, which would be 5% above the five-year average and 1% above October 2025 levels. The agency also expects marketed production to expand by 4.5 Bcf per day in 2026, with the Permian and Haynesville basins contributing over 70% of that growth.
These supply-side factors cap the bullish thesis. A weather-driven rally remains possible, but it must overcome expanding supply and an already visible storage cushion. For producers, the broader futures strip is more important than a single front-month settlement, while funds that roll gas futures must contend with both price trajectories and replacement costs.
The LNG Wildcard
The material counterargument is liquefied natural gas (LNG) demand. The same EIA outlook projects U.S. LNG exports to reach 17.4 Bcf per day in 2026, up from 15.1 Bcf per day in 2025—a roughly 15% increase. Strong export utilization, an unusually hot late September, early cold snaps, or a production disruption could erode the surplus faster than current prices imply.
The South Central salt-cavern draw is an early reminder of this optionality, though it does not yet indicate a shortage. The next decisive test comes with the EIA's storage report on September 17. Bulls need either a materially smaller-than-expected build or a renewed demand shock to justify a move above $3. Without such catalysts, the 148 Bcf cushion makes $3 a demanding threshold rather than an obvious bargain.
Investors and traders should monitor regional storage dynamics, weather forecasts, and LNG export trends in the coming weeks to gauge whether the market can break out of its current range or remains anchored by oversupply.