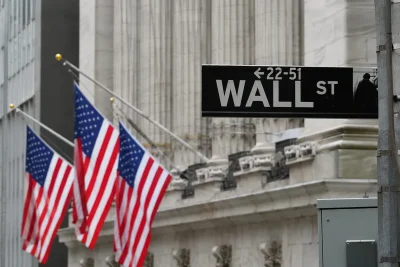
U.S. stock markets showed tentative signs of stabilization on Monday, attempting to halt a five-week losing streak that has brought the benchmark S&P 500 index perilously close to a technical correction. The recent sell-off, fueled by geopolitical tensions in the Middle East and a sharp spike in oil prices, prompted investors to search for a potential floor. By midday trading, the Dow Jones Industrial Average had advanced 0.5%, while the S&P 500 gained 0.2%. The Nasdaq Composite traded largely flat, even as crude oil prices surged once again.
Market Under Pressure from Oil and Fed Outlook
The challenges extend beyond a simple rough patch for equities. The price of Brent crude oil has skyrocketed approximately 60% during the month of March alone, raising significant concerns about persistent inflationary pressures. Concurrently, traders in interest rate futures have completely priced out expectations for Federal Reserve rate cuts in 2026, a stark reversal from earlier forecasts. A slate of key economic data on payrolls and retail sales scheduled for release this week will be scrutinized for signs that soaring energy costs are beginning to dampen economic growth. In remarks on Monday, Fed Chair Jerome Powell reiterated the central bank's unwavering commitment to returning inflation to its 2% target, despite the ongoing conflict in the Middle East.
The previous trading session on Friday concluded with the S&P 500 at 6,368.85, marking a 1.7% daily decline. The index now sits roughly 8.7% below its record high set on January 27. Both the Dow and the Nasdaq have retreated more than 10% from their respective peaks, a decline magnitude that Wall Street traditionally defines as a correction.
Technical Weakness and Shifting Valuations
Analysts note the S&P 500 is mired in significant technical weakness. The index has consistently traded below its 50-day moving average since February 27 and fell beneath its critical 200-day moving average on March 19. These levels are closely watched by traders as indicators of market momentum. However, the pronounced sell-off has also made stock valuations more attractive. The S&P 500's price-to-earnings ratio, based on projected earnings, has declined to just under 20, down from over 22 at the end of 2025. Concurrently, earnings growth estimates for the next twelve months have risen to 17%, potentially laying the groundwork for a future rebound.
The Bull and Bear Cases for a Rebound
This valuation reset forms the core of the bull case for a market recovery. Some strategists point to historical precedents, such as the setups in 2015 and 2023, which subsequently delivered median gains of around 10% over the following six months. This perspective frames the current downturn as a "correction within a bull market"—a temporary setback in a longer-term upward trend. Conversely, other analysts caution that the market has yet to experience true capitulation, where fearful investors fully purge risk from their portfolios, suggesting more pain may be necessary to form a durable bottom.
Monday's muted gains were viewed by some as merely a technical bounce. Several market sectors had reached oversold conditions, making them ripe for a short-term pop from bargain-seeking traders. A slightly more optimistic view suggests diplomatic progress could provide a catalyst for relief. A notable divergence has also emerged beneath the surface of the major indexes. While the standard S&P 500, heavily influenced by mega-cap technology stocks, has fallen 6.96% year-to-date, the equal-weight version of the index is down a more modest 1.56%. This indicates the market's losses have been disproportionately driven by its largest constituents.
Wall Street Adopts a Cautious Stance
A cautious mood continues to dominate Wall Street. Highlighting this sentiment, Morgan Stanley downgraded its stance on global equities to "equal weight," a neutral position. The firm warned that equity valuations could plummet by almost 25% if oil prices remain entrenched between $150 and $180 per barrel. Technical analysts are also watching key support levels, noting that after the S&P 500 breached the 6,500 level, the next critical line of defense is seen near 6,150, with 6,000 looming beyond that.
The pressure is not confined to the stock market. Liquidity in the Treasury market has shown signs of strain, with bid-ask spreads for new two-year notes widening by about 27% in March compared to February. This is a clear signal that market makers are pulling back, reducing risk and making it more costly to trade.
Investors are now balancing conflicting signals: improved stock valuations against the threat of sustained high oil prices. If crude prices retreat and this week's economic data remains resilient, the market floor that many strategists are anticipating may finally materialize. However, if shipping disruptions in the critical Strait of Hormuz persist and inflation reignites, the recent five-week decline may prove to be only the beginning of a deeper downturn.