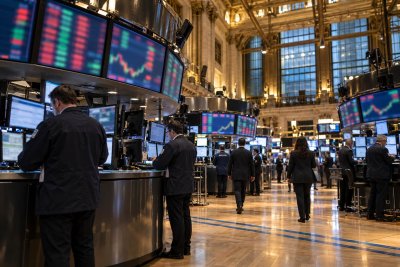
The Cboe Volatility Index, commonly known as the VIX, advanced for a second consecutive session on Wednesday, settling at 16.25—a gain of 0.53 points, or 3.37%. The move came as Brent crude oil closed above $101 per barrel and Treasury yields edged higher, creating a backdrop of heightened concern among equity investors. However, the structure of the VIX futures market suggests that while uncertainty is being priced, there is no immediate panic.
The VIX measures the market's expectation of S&P 500 volatility over the next 30 days, derived from option prices. At 16.25, the implied annualized volatility translates to an expected daily move of roughly 1.0% in the S&P 500, based on a simple calculation dividing the VIX by the square root of the number of trading days in a year. This is a statistical estimate, not a guaranteed range, but it provides a useful gauge for investors.
Wednesday's session offered clear catalysts for increased hedging activity. Brent crude surged 3.4% to $101.21 per barrel amid escalating U.S.-Iran tensions, raising supply concerns. Meanwhile, the 10-year Treasury yield finished near 4.84%, up four basis points from Tuesday, making fixed-income investments more competitive with equities. Despite these pressures, the S&P 500 declined only 0.48%, with energy stocks advancing and Meta Platforms gaining 6.6%, helping to cushion the broader market.
Futures Curve: Contango Indicates Caution, Not Crisis
The VIX futures curve provides a more nuanced view of market sentiment. The front-month September 16 contract settled at 16.6283, about 2.3% above the spot VIX close, while the October 21 contract settled at 18.402, a 13.2% premium. November and December futures were even higher, at 19.1354 and 19.2512, respectively.
This upward-sloping curve, known as contango, means that later-dated contracts are more expensive than near-term ones. While this indicates that traders are paying more for volatility protection further out, it is not an unusual condition. Historically, VIX futures have been in contango more than 80% of the time since 2010, as volatility tends to revert upward after periods of calm.
It is important to note that futures prices are not guaranteed forecasts of the VIX on expiration. They incorporate supply and demand dynamics, as well as compensation for bearing volatility risk. The key takeaway from the curve is relative: traders are pricing persistent uncertainty, but the spot VIX has not surged above the front-month contract, which would signal backwardation—a pattern often associated with acute stress and a sudden demand for immediate protection.
Upcoming Catalysts: PPI, CPI, and Fed Meeting
The VIX's 30-day window already encompasses several significant events. Thursday, September 10, will see the release of the August Producer Price Index (PPI) at 8:30 a.m. Eastern, followed by the Consumer Price Index (CPI) on Friday, September 11. The Federal Reserve's policy meeting is scheduled for September 15–16, adding another layer of uncertainty.
If inflation data comes in cooler than expected and crude oil retreats from its recent highs, the need for near-term protection could diminish. Conversely, a hot inflation print combined with oil remaining above $100 could push Treasury yields and the VIX higher. The most difficult risk to price is an unexpected disruption to energy flows, which could occur outside the scheduled economic calendar.
Navigating the Trade: Not as Simple as Buying the VIX
Investors cannot directly purchase the spot VIX. Instead, they use futures, options, and exchange-traded volatility products, which behave differently. An upward futures curve can impose a recurring roll cost on products that sell expiring contracts and buy more expensive later-dated ones. Therefore, even if an investor correctly anticipates a rise in volatility, poor timing can result in losses.
Some market participants argue that a VIX level of 16.25 understates the tail risks from oil, geopolitical tensions, and a potentially hawkish Fed. While this is a plausible view, Wednesday's market action did not indicate disorder. The spot VIX remained below all major monthly futures and well under the 52-week high of 35.30. A move toward 20, accompanied by broader equity selling, would strengthen the stress signal. For now, the futures curve suggests that investors are paying for a dangerous calendar while treating the danger as containable.